Current Plan and Related Documents

Overview: 

In 2021 and 2022, states and localities reached historic settlements with manufacturers and distributors of opioids, as well as pharmacy chains and a consulting firm, for their roles in the opioid epidemic. The settlement funds were designed to promote the long-term goals of (1) reducing fatal overdoses and (2) reducing the harms from opioid use disorder. As a result of these settlements, Allegheny County will receive annual payments in varying amounts through at least 2038. To date, Allegheny County has received two payments in 2022 totaling $8.4M and a third payment in 2023 totaling $6.05M.

Analysis: 

This report is meant to provide background on the national opioid settlements and share updates on how Allegheny County invested the first two payments received from opioid settlements to bolster our ongoing investments in the broader substance use services system. The dashboard provides additional information about the fund and the initiatives the money is supporting.

Trouble viewing the dashboard below? You can view it directly here.

Current information

Since 2016, the Allegheny County Department of Human Services (DHS) in Pennsylvania has utilized the Allegheny Family Screening Tool (AFST), which assists child welfare call screening caseworkers in their assessment of general protective service (GPS) referrals regarding potential child maltreatment.

What is this report about?

This report reviews the research evidence on algorithms in child welfare, specifically focusing on the causal impacts of the AFST and comparable predictive risk models (PRMs). It begins by summarizing the influence of these tools on child welfare decisions. The report then explores the discrepancies between perceived and actual effects of these models, highlighting the importance of bridging the gap between perception and reality to alleviate concerns and maximize the effectiveness of these tools.

What are the takeaways?

The impacts of predictive risk models in child welfare must be compared with alternative approaches to augmenting call screening caseworker decision-making. Traditional risk assessments in child welfare have been largely manual, prone to inconsistencies, and often omit critical information. Before implementing the AFST, Allegheny County did not employ any structured risk assessment.

The main conclusions from recent research on the AFST are:

  • The AFST changed the composition of investigated referrals. The introduction of the AFST decreased the probability of investigation for referrals with low risk of removal and increased the probability of investigation among referrals with high risk of removal. The introduction of the AFST also reduced the racial gap in investigation rates, particularly among higher risk referrals.
  • The AFST is reducing, not increasing, racial disparities. Researchers found that the introduction of the model reduced racial disparities in investigation rates across AFST scores, although the size and precision of the reduction varied. The AFST reduced the racial disparity in investigation rates for the highest risk referrals by 83%, from 10.6% to 1.8%. The researchers estimated that the AFST reduced the Black–White gap in removal rates of screened-in referrals by 73%, from 4.3% to 1.2%.
  • Screeners use the algorithm but with caution. Researchers found that call screening case workers are integrating information from the AFST effectively, aligning their decisions more closely with predicted removal risk compared with the period before the tool’s introduction. The tool is seen as a helpful source of additional information rather than a replacement for professional judgment. 

How is this report being used?

The application of algorithms to support decision-making, especially in sensitive areas like child welfare, mandates high transparency. It is critical that the complexities of predictive risk models are communicated clearly to all stakeholders to maintain trust and prevent misuse. DHS is committed to keeping the public informed about the use and impact of algorithms at the Department and draw upon current research to shape the implementation of these tools in the field.

Read more about AFST here.

Current dataset and related materials

What is the Community Need Index?

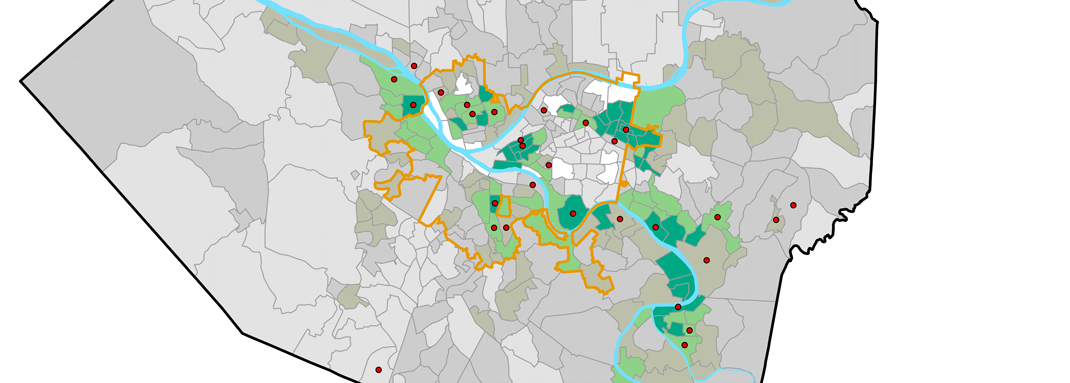
The Allegheny County Department of Human Services (DHS) conducts a Community Need Index (CNI) to identify specific areas that are in greater need, and face larger socioeconomic barriers, relative to others. The newest version of the CNI index ranks neighborhoods by need level by looking at:

  • The percentage of families who live below the poverty line
  • The percentage of unemployed or unattached males
  • The percentage of those aged 25 and up without at least a Bachelor’s degree
  • The percentage of single parent households
  • The percentage of households without internet access
  • Rate of homicide per 100,000 residents
  • Rate of fatal overdoses per 100,000 residents

The researchers used a census tract level to break up the region and assess needs. Census tracts are static, relatively small subdivisions of a county.

How can I view the findings?

An interactive map allows users to view and extract data from the 2024 CNI (which uses 2022 five-year data estimates and totals). The new report focuses on all of Allegheny County, examines changes in need over time, and places emphasis on the connection between race and community need. Earlier reports are linked below.

What are the takeaways?

  • In Allegheny County, we continue to find the highest levels of need in specific sections of the City of Pittsburgh (Hill District, South Hilltop, parts of the West End, Upper East End neighborhoods, Upper Northside) as well as census tracts outside the City of Pittsburgh (Mon Valley, sections of the Allegheny County River Valley, sections of Penn Hills, sections of Wilkinsburg, Stowe-Rocks).
  • There are vast discrepancies between the lowest need communities, which have an average poverty rate of 2%, and the highest need communities, where the average poverty rate is 38%.
  • With few exceptions, census tract-level community need is persistent over time.
  • Only about one-third of Allegheny County’s Black residents live in lower-need communities. For every other racial and ethnic group in the County, the majority of residents live in lower need communities. Black communities in Allegheny County have disproportionately high levels of need, as do a number of racially mixed communities. 
  • Poverty status alone does not account for where various racial and ethnic groups tend to live by level of need; poor Black and Latino families are more likely than other poor families to live in higher need communities. Even Black families above the poverty line are many times more likely than their Asian, White and Latino peers above the poverty line to live in higher need communities.

How is this report used?

The geographic dimensions of community need can help inform many aspects of DHS’s strategic planning and resource allocation decisions, such as decisions on where to locate Family Centers or new after-school programs.

Where can I go for more information?

For more information, you can read previous reports below. Or you can reach out to DHS-Research@alleghenycounty.us with any questions.


Previous reports in this series 

Previous datasets in this series

Current Plan and Related Documents

The Allegheny County Department of Human Services (DHS) partnered with Pittsburgh Regional Transit (PRT) to launch a new transportation assistance program in November 2022 called the Discounted Fares Pilot. This program offered free and reduced-price PRT rides for county residents ages 18 to 64 who receive Supplemental Nutrition Assistance Program (SNAP) benefits, along with their 6- to 17-year-old children. The fare discounts were allocated using a lottery. Each household in the pilot was randomly assigned to one of three groups, each with equal probability. One group received unlimited free PRT trips, a second group received a 50% discount on all PRT trips, and a third group received no discount. The fare discounts lasted for at least 12 months for the free-fare and half-fare groups.  

What is this report about?

This report first describes the results from the first year of the pilot.  It describes the design of the pilot, the characteristics of the participants and provides estimates of the causal impact of the fare discounts on travel behavior and health care utilization.  It also reports on impacts on self-reported outcomes related to employment, financial stability, and well-being.

What are the takeaways?

  • A total of 9,544 adults and 4,928 children enrolled in the Pilot during the three-month open enrollment period. The majority of adult participants were female (72%) and Black (59%). Participants reported taking an average of ten PRT trips per week and spending an average of nearly $30 on public transportation per week at the time they enrolled in the Pilot.
  • Most participants successfully received their Pilot-issued farecard and used the card at least one time. 90 percent of adults in the free-fares group tapped their assigned farecard at least once. 82 percent of the half-fares group and 81 percent of the no-discount group tapped their farecard at least once. The majority of farecard non-users likely never received their assigned card.
  • Larger fare discounts resulted in greater use of Pilot-issued farecards. Participants in the half-fares group tapped their assigned farecards an average of 1.6 more times per week than the no-discount group. Participants in the free-fares group tapped their assigned farecards an average of 3.3 more times per week than the half-fare group. 
  • The fare discounts yielded improvements in certain measures of financial savings and transportation security. In particular, the free fares reduced self-reported weekly spending on PRT trips by more than $17 relative to no discount while there was an $8.92 decrease in weekly spending on average for the 50% discount group. Free fares led to a 26 percentage-point decrease, while 50% discounts resulted in a 10 percentage-point drop in the self-reported likelihood of missing work or other appointments in the past four weeks due to transportation issues.
  • Discounted fares had limited effects on health care utilization, with no clear patterns emerging in terms of increased or decreased use of care. The fare discounts had no discernible impact on participants’ likelihood of receiving Medicaid-funded health care in the first 270 days after they enrolled in the Pilot.

How is this being used? 

DHS is using the Pilot results to better understand the ways that low-income households may benefit from reduced PRT fares. We will continue to refine our understanding by analyzing longer-term outcomes and by incorporating insights from qualitative interviews that were conducted with a subset of participants. These findings will be shared in a future publication.

DHS has also used the preliminary Pilot results to inform the design and implementation of a longer-term program that will offer a 50% PRT discount for working-age county SNAP beneficiaries and their children. This new program, called Allegheny Go, is scheduled to launch in June 2024.

Other information

Research Plan

Current information

DHS has set five goals to guide us and our partners in serving our community well. We aim for our network for human services to improve access to care, prevent overuse of coercive services, prevent harm, increase economic security and ensure quality.

What is this report about?

DHS can reach our goals more quickly if we devote time and attention to several big, bold initiatives that will make our systems and our organization work better for everyone we serve. This document outlines our key initiatives in 2024—which are in addition to our core work of running effective systems of care for people.

Current information

County human services includes programs from over 300 community-based agencies and is delivered by social workers, peers, and outreach staff working all throughout the county. These staff run out-of-school-time programs, answer hotlines, investigate reports of potential harm to children and vulnerable adults, deliver meals to seniors and run Senior Centers, make home visits to families with newborns, and do the administrative work that makes our human services run efficiently.

What is this report about?

This report highlights the 2023 accomplishments that stood out. There are many, many other achievements that people told us about. We chose the ones that made the biggest difference.

In Allegheny County, a network of shelters provides a temporary place to stay for people experiencing homelessness. Allegheny County’s emergency shelter network includes facilities which serve adults only and others that offer accommodations to families with children or other dependents. The County strives to ensure that every shelter stay is rare, brief and non-recurring.

Individuals in adult-only households make up about three-quarters of all shelter users. This data brief focuses on the 1,560 adults who entered one of the County’s 13 adult-only emergency shelters once or more from April 2022 through March 2023..  For descriptions of other people served in the homeless system, see these related data briefs: “Families using emergency shelters in Allegheny County” and “People Experiencing Unsheltered Homelessness in Allegheny County.

  • 70% (N=1,096) of the people using adult-only shelters were men. Black individuals were overrepresented, making up 51% of those using shelter but only 14% of Allegheny County’s population. 80% of people were between 25 and 64 years old and relatively evenly distributed among the four age groups in that range. 13% were ages 18 through 24 and 7% were 65 or older.
  • 76% (N=1,181) of people had only one shelter stay during the period of study. 15% had two stays and 9% had three or more.
  • Half of the shelter stays were for two weeks or less. 25% of shelter stays lasted five days or fewer and 75% were for 54 days or fewer.
  • Most of the people using shelters had recent addresses in Allegheny County communities. 46% had recent addresses in the City of Pittsburgh, with the most common neighborhoods being Carrick, East Liberty, Marshall-Shadeland and Sheradan. The remaining 54% had addresses outside of the City, with the most common municipalities being McKeesport, Wilkinsburg and Penn Hills.
  • Among shelter exits for which we have exit information, 49% (N=760) of stays resulted in exits to stable housing.  Almost half of the people who exited their stay(s) within two weeks exited to stable housing, increasing to 58-65% of people who exited their stay(s) after a month.
  • Less than half of individuals reported income from any source. PA Department of Labor and Industry data provides some insight over time; about one-third of people using shelter were employed in any given quarter from 2017 through 2022. For those who were employed, wages averaged between $663–$1,017 per month.
  • 17% (N=259) of people had a shelter stay in the year prior to their first stay in the study period. 8% (N=132) were engaged in a supportive housing program in the year prior to their shelter stay.
  • Other services and system involvement:
    • Behavioral health services. Among adult shelter users enrolled in Medicaid (N=945), more than 75% accessed behavioral health services. 43% (N=404) accessed mental health outpatient care, 39% used a mental health crisis service and 15% used a mental health inpatient service. The most frequent mental health diagnoses were depressive disorder, adjustment disorder, schizophrenia and bipolar disorder. 35% (N=327) used a substance use disorder service. The top substance use disorders involve opioids and alcohol.
    • Physical health services. For Medicaid-enrolled individuals, the most common chronic condition was hypertension, followed by kidney disease and diabetes. Adults using shelter have higher rates of many chronic diseases than those in the general Medicaid-enrolled population in the County.
    • Criminal Justice System. About a third of people were involved with the adult criminal justice system in the year prior to their shelter stay.
    • Other services. Five percent (N=75) of adults were involved in child welfare as a parent. 20% (N=46) of older adults (aged 60+) using shelter were connected to aging services in the year prior to their entry.

Emergency shelters are meant to be short-term housing for people experiencing a crisis. The County’s goal is to ensure that shelter stays are rare, brief and non-recurring.  The County is working with shelter staff and other housing providers to support client moves to stable housing when possible, with the goal of improving their overall outcomes and ensuring that short-term beds are available when people need them.

Current Information

Allegheny County Department of Human Services (DHS) believes that appropriate sharing of client information is essential to the provision, continuity and overall quality of care provided to DHS clients. It has created a number of tools and mechanisms to facilitate this sharing, including the creation of tools for contracted providers to access information on clients they are serving and mechanisms for providers to safely and security share client information back with DHS. Read more about this here and access the tools through the below links.

Where can I access provider tools?

Links to clientivew, a tool for individual care coordination, and provider connect, a tool for to support provider decision-making, are found here. You can also access data exchange, one of the tools that providers can use to securely share information back with DHS.

How I can gain access to these tools if I don’t already have it?

If you are a contracted provider with DHS, you can request access to provider tools through DHS’s application support portal.

Learn more about the Data Warehouse

What is the Allegheny County Data Warehouse?

The Allegheny County Data Warehouse brings together and integrates client and service data from a wide variety of sources both internal and external to the County.

How was the Data Warehouse developed?

The Data Warehouse was created by consolidating publicly-funded human services data (e.g., behavioral health, child welfare, developmental supports, homelessness and aging) and, over time, expanded to include data from other sources. The Data Warehouse was made possible with support from the Human Service Integration Fund, a flexible funding pool created by a coalition of local foundations for the purpose of supporting integration and innovation within DHS.

How does the Data Warehouse support of the work of Allegheny County?

The Data Warehouse was designed primarily to improve services to clients, but also to improve the ability of workers to perform their jobs and to support management decisionmaking; it is also intended to be available as a community resource, making data and information publicly available whenever possible.

Where can I learn more?

  • This overview document describes the development of the Data Warehouse, the County’s data sharing partnerships, and how the data is utilized to support client services and decisionmaking. 

What is the DHS case competition?

Each year, the Allegheny County Department of Human Services (DHS) hosts a competition for local graduate students that challenges interdisciplinary teams to solve a problem in local government.

What information is available?

Yearly reports, below, describe the case topic and students’ proposed solutions. A short video explains the event.


All reports

  • 2023: Improving outcomes for people involved in an involuntary commitment
  • 2022: Innovating in the Aftershock of COVID-19: A Post-Pandemic Local Government Playbook
  • 2019: Human Service Delivery in the Gig Economy
  • 2018: Emerging Technologies to Address Human Service Problems
  • 2017: Rethinking Human Services Delivery
  • 2016: Improving Systems to Help People with Barriers Gain and Sustain Employment
  • 2015: Making Transportation Work: Creating Access and Ensuring Equity
  • 2014: Pathways to Safe and Affordable Housing for People Involved in the Human Services System
  • 2013: Building a Human Services Workforce for the 21st Century
  • 2012: Addressing Suburban Poverty and Those Affected by It
  • 2011: Reducing Stigma among Individuals with Serious Mental Illness
  • 2010: Pittsburgh Public Schools and the Pathways to the Promise
  • 2009: Building the Homewood Children’s Village
  • 2008: Greening DHS
  • 2007: The Future of DHS

In its responsibility for administering publicly-funded human services, Allegheny County Department of Human Services (DHS) plans for the allocation of more than $1B in areas that span behavioral health, children and families, aging, housing and homelessness, and intellectual disability and autism services.

How does DHS plan its allocation of resources?

DHS planning activities are ongoing and iterative. They include:

What is the County Human Services Plan?

The County Human Services Plan consolidates planning requirements for categorical components of the Human Services Block Grant, including Mental Health Community Base-Funded Services, Behavioral Health Services Initiative (BHSI), Intellectual Disabilities Community Base-Funded Services, Act 152 of 1988 Drug and Alcohol Services, Homeless Assistance Program Funding, and Human Services Development Funds. It is submitted annually to the PA Department of Human Services, 60 days after the agency releases its annual bulletin (usually in the summer).

What is the Needs-Based Plan and Budget?

The Needs-Based Plan and Budget articulates Allegheny County’s priorities, planned services, and resource needs for serving children and families – in particular those children and families who are involved with, or at risk of involvement with, the child welfare and juvenile justice systems. It is submitted annually to the PA Department of Human Services, Office of Children, Youth & Families (the budget narrative submission deadline is August 15th every year).

State Fiscal Year (SFY) 2024-25

Older plans:

What is the Area Agency on Aging Strategic Plan?

The Allegheny County Area Agency on Aging (AAA) is part of a nationwide aging network led by the U.S. Administration on Community Living and the Pennsylvania Department on Aging (PDA). Every four years, PDA requires each of the Commonwealth’s fifty-two (52) Area Agencies on Aging to submit an action plan for the following four years. This Four-Year Plan considers the demographic trends of the region, the changing needs of the consumers, and the current services provided by the Allegheny County AAA.

Additionally, every year the Allegheny County AAA releases Program Updates and a Budget Prospectus, as well as an Annual Report.

Community Services Needs Assessment & Strategic Plan

Allegheny County DHS is the designated community action agency for the receipt of the County’s (outside the City of Pittsburgh) Community Services Block Grant (CSBG) funds. CSBG is a federally funded block grant from the US Department of Health and Human Services, Administration for Children & Families, Office of Community Services that supports services aiming to alleviate the causes and conditions of poverty in under resourced communities. CSBG recipients are required to conduct a needs assessment and develop a strategic plan no less than every 5 years.  

Housing and Homelessness

Allegheny County DHS, through its Office of Community Services, is the designated Infrastructure Organization and United Funding Agency for the Allegheny County Continuum of Care (CoC) – the network of services and stakeholders engaged in making homelessness rare, brief and non-recurring. Starting in 2016, the CoC underwent a community planning process to create its strategic plan. The strategic planning process is summarized in Preventing and Ending Homelessness – Community Strategic Planning Process. Principles guiding the strategic plan can be found in the Guiding Principles: Allegheny County Plan to Prevent & End Homelessness. The working board of the CoC, the Homeless Advisory Board (HAB), voted to accept the plan on July 25, 2017.

Opioid Settlement Funding

Other plans

Current Information

The Allegheny County Department of Human Services (DHS) conducted a study of the involuntary hospitalization program in the county. Involuntary hospitalizations occur when an individual undergoing a psychiatric episode is deemed to be a clear and present danger to themselves or others.  The specific section that governs the intake process of an individual is Section 302 of the Mental Health Procedures Act (MHPA), and for that reason the entire program is sometimes called the 302 program.

Evaluations occur in a hospital setting. Following an upheld commitment individuals can initially be detained for up to 120 hours, with the potential for extensions. The county seeks to understand the system in detail and improve outcomes among individuals who go through this process.

What is this report about?

This report describes individuals who went through the involuntary hospitalization program from 2015-2022. The analysis profiles the individuals including their characteristics such as diagnosis, their usage of mental and behavioral health services, and their outcomes post release. 

What are the takeaways?

  • Involuntary hospitalizations are common, affecting over 3,700 residents each year. The most common source of referrals occur from friend / family (43%), police officers (19%), and physicians (14%).
  • Individuals who are involuntarily hospitalized have poor outcomes upon release—within 5 years of their first evaluation, fully 20% of the population has died, a rate that is higher than that for clients exiting jail, enrolling in homeless shelters, or receiving food assistance (SNAP) as well as the rate for individuals with severe mental illness (SMI) diagnoses.
  • We find worse outcomes among 302 individuals with a pre-existing substance use disorder (SUD)— 5% of those with SUD 18–50 years of age die within two years of intake, compared to 2.5% of the 18–50-year-olds without SUD. Of those with SUD, eighty percent (60%) of the mortality rate is attributable to drug overdose.
  • We found similarly elevated risks for other adverse outcomes. Over 23% were charged with a crime within 5 years of release, and 60% used an emergency department (ED) within one year of release.
  • Statistical methods can distinguish between riskier and less risky clients with high fidelity at the moment of the 302 evaluation.
  • Those petitioned for involuntary commitment were disproportionately Black, although petition-upheld rates are similar across race. A similar picture emerges for gender—men were more likely to be petitioned, but upheld rates at the point of exam were similar for men and women.

How is this report being used?

The report serves as an initial analysis into the involuntary hospitalization process. The county is using this analysis, as well as planned subsequent ones that look at the impact of an involuntary hospitalization on a person’s outcomes, and input from clinicians and community members to develop recommendations to improve care for this vulnerable population. Ultimately the county is looking to improve both the process and the outcomes for individuals who experience an involuntary hospitalization.

Making good, informed decisions about how to allocate limited resources is an ever-evolving process. The Allegheny County Department of Human Services (DHS) strives to make the most equitable decisions when allocating scarce resources for individuals and families in need. Housing is a critical resource for which demand far exceeds supply; thus, DHS is dedicated to making sure that those most at need have priority for the housing services that are available. Since 2017, DHS has developed predictive risk models that utilize administrative data to assign a risk score that is used to determine the appropriate course of action. Two of these models were developed to support prioritization of housing resources.

Allegheny Housing Assessment (AHA)

In 2020, DHS launched the Allegheny Housing Assessment (AHA), a decision support tool designed to help prioritize admissions to supportive housing services for individuals or families experiencing homelessness. The AHA forms the infrastructure for DHS’s coordinated entry system for those in a housing crisis.

The tool uses administrative data from Allegheny County’s data warehouse to predict the likelihood of three types of events occurring in a person’s life if they remain unhoused over the next 12 months: 1) a mental health inpatient stay, 2) a jail booking and 3) frequent use (4 or more visits) of hospital emergency rooms.  These events serve as indicators of harm if a person remains unhoused. The AHA assigns a risk score that is used as part of the housing prioritization process; it is far more objective and unbiased than earlier assessment tools and it doesn’t require the time or trauma associated with asking sensitive questions at the time of housing crisis.

Mental Health – Allegheny Housing Assessment (MH-AHA)

After a couple of years of experience with the AHA, DHS leadership realized that a similar tool could help prioritize admissions to residential services for individuals with a diagnosis of serious and persistent mental illness. Using the AHA as a starting point, the team developed the Mental Health – Allegheny Housing Assessment (MH-AHA) and launched it in February 2023.

Similar to the AHA, the MH-AHA utilizes administrative data from Allegheny County’s data warehouse to predict the likelihood of two potential types of adverse events that may occur in an individual’s life if they do not receive adequate support for their MH condition over the next 12 months: 1) a mental health inpatient stay and 2) frequent use [4 or more visits] of hospital emergency departments. These events serve as indicators of harm and are things we would like to prevent. The MH-AHA assigns a risk score that is used as part of the prioritization process. Individuals who are not eligible or who do not receive a risk score likely to lead to a placement in the near future will be introduced to other supportive services options instead of waiting a long time on a waiting list for a placement that might not occur.

By prioritizing those most in need of MH residential services, the MH-AHA will simplify the referral process, decrease uncertainty and reduce wait times. In addition, it will help Allegheny County document unmet MH residential needs created by the gap between limited MH residential resources and the number of high-risk eligible individuals. An external impact evaluation by researchers at Stanford will document progress toward these goals.

Select from the following documents to learn more about the AHA tool:

Select from the following documents to learn more about the MH-AHA:

Current Information

In May 2022, Allegheny County assembled a taskforce of leaders to reduce intimate partner violence (IPV) through improved coordination, information sharing, training, and implementation of interventions that target both those who use violence and those who are victims or survivors of it.

Historically, the County’s understanding of IPV has been based on national data, which, though useful, fails to capture local nuances that lend greater insight into specific community needs. The objective of this report is to provide more local context to problems of IPV in Allegheny County by describing trends in demographics, human services involvement, and criminal histories among victims and perpetrators of intimate partner homicides (IPH) from January 2017 through September 2022. Importantly, the findings presented here point to a disproportionate impact on individuals who are disadvantaged not only by their gender identity, but also by systemic racial and socioeconomic inequalities. Though IPV has traditionally been framed as an issue related to gender alone, a more intersectional understanding of risk and impact can better inform strategies for effective prevention and mitigation.

Key Findings

  • There were 45 victims (43 incidents) of IPV and IPV-spillover homicides from January 2017 through September 2022.
  • The demographic trends among individuals involved in IPH are similar to those of overall homicides: victims and perpetrators are disproportionately Black, young (aged 25-34) and living in high-need areas. Black women represent the highest proportion of victims (37%, n=16), while Black men constitute the highest proportion of perpetrators (56%, n=23).
  • Unlike homicides at large, IPH victimization disproportionately impacts women: 63% of victims of IPH are women.  While IPH accounted for roughly 7% of all homicides from January 2017 through September 2022, they made up 30% of all homicides with female victims.
  • Both victims and perpetrators of IPH had high rates of involvement in human services.  74% of perpetrators had prior involvement with child welfare, publicly funded behavioral health, or homeless and housing systems.
  • 58% of victims had prior involvement with child welfare, publicly funded behavioral health, or homeless and housing systems.
  • Across all gender, race and role categories, about 53% of individuals involved in IPH – 47 of 88 – had criminal justice involvement at some point prior to the homicide incident: 63% of perpetrators (27 of 43) and 44% of victims (20 of 45). Among perpetrators with criminal justice involvement, both Black and White men had higher rates of involvement than either Black or White women.
  • Roughly 24% of all IPV perpetrators had indicators of IPV history in either the criminal courts or child protection system. This is likely an undercount of true IPV history, as data limitations, legal restrictions and underreporting make identification of non-fatal IPV in the data difficult. Among those with domestic violence related criminal cases, the majority occurred in the 18 months prior to the homicide incident.