Infographics
Infographics to better understand issues affecting Allegheny County residents.
Filter by
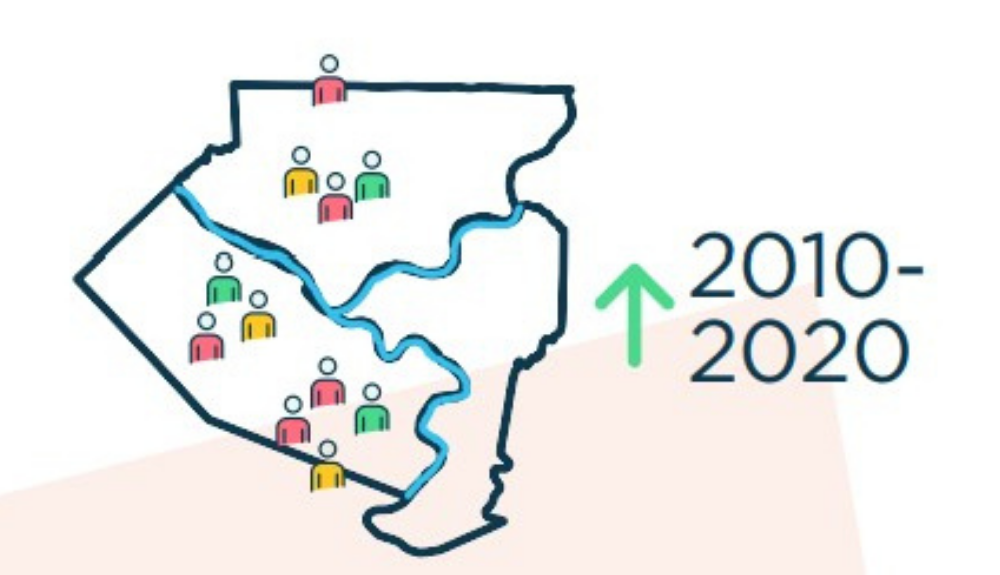
Latinx Needs Assessment
The Latinx population in Allegheny County grew 80% between 2010 and 2020. This most recent community assessment report found several clear themes and opportunities for better serving the Latinx community.
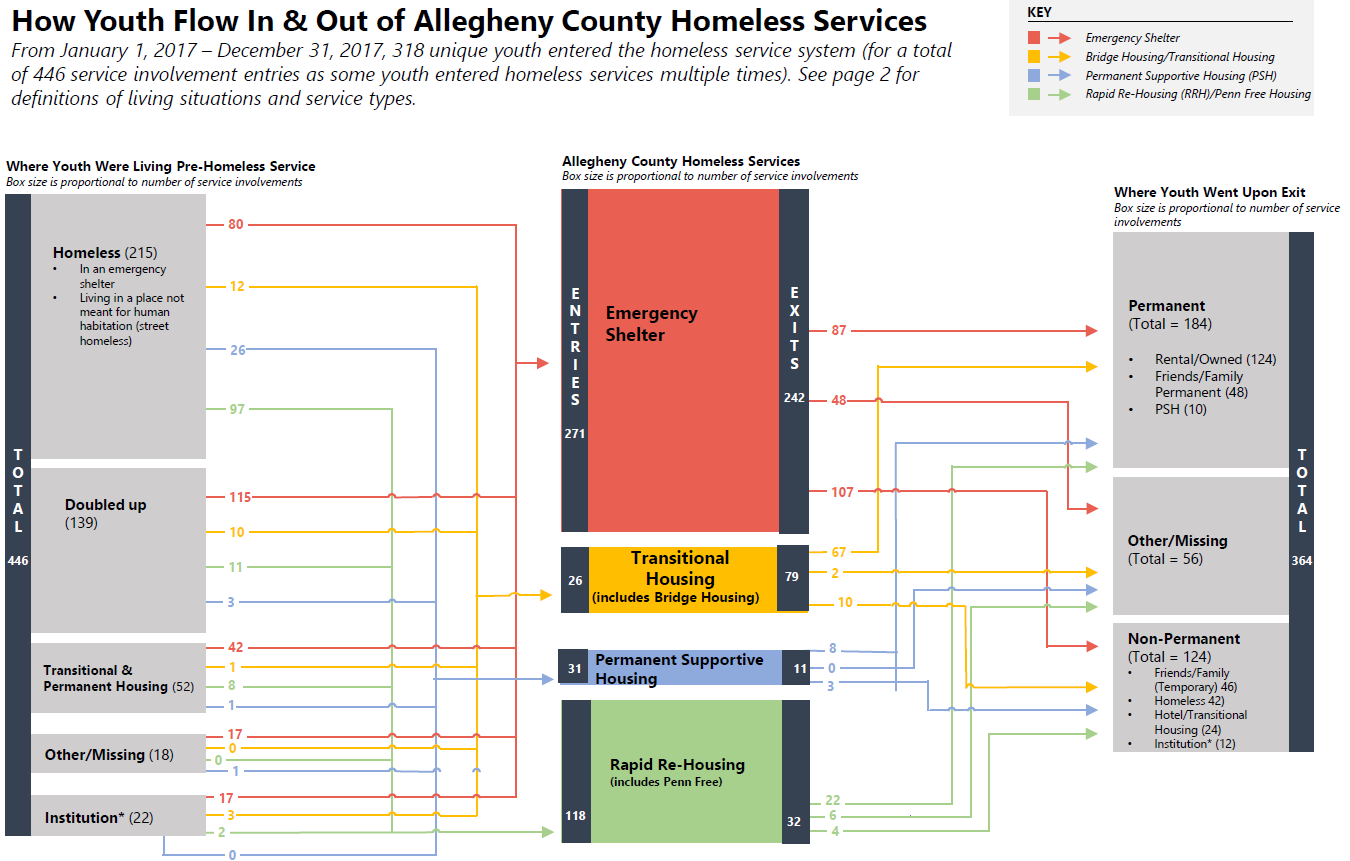
How Youth Flow In and Out of Homeless Services (2017)
This infographic depicts the flow of homeless youth in and out of Allegheny County’s homeless service system in 2017. Analyzing the housing services that youth used — in addition to the […]
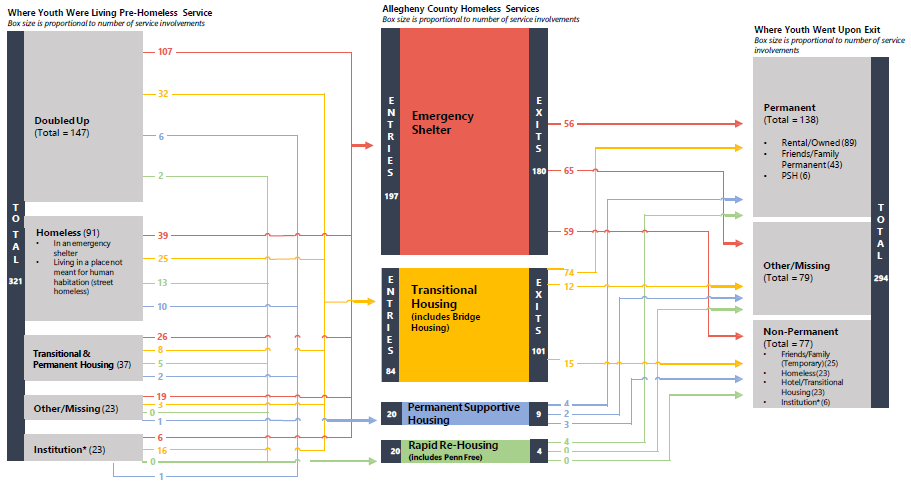
How Youth Flow In and Out of Homeless Services (2016)
This infographic depicts the flow of homeless youth in and out of Allegheny County’s homeless service system. Analyzing the housing services that youth used — in addition to the places […]