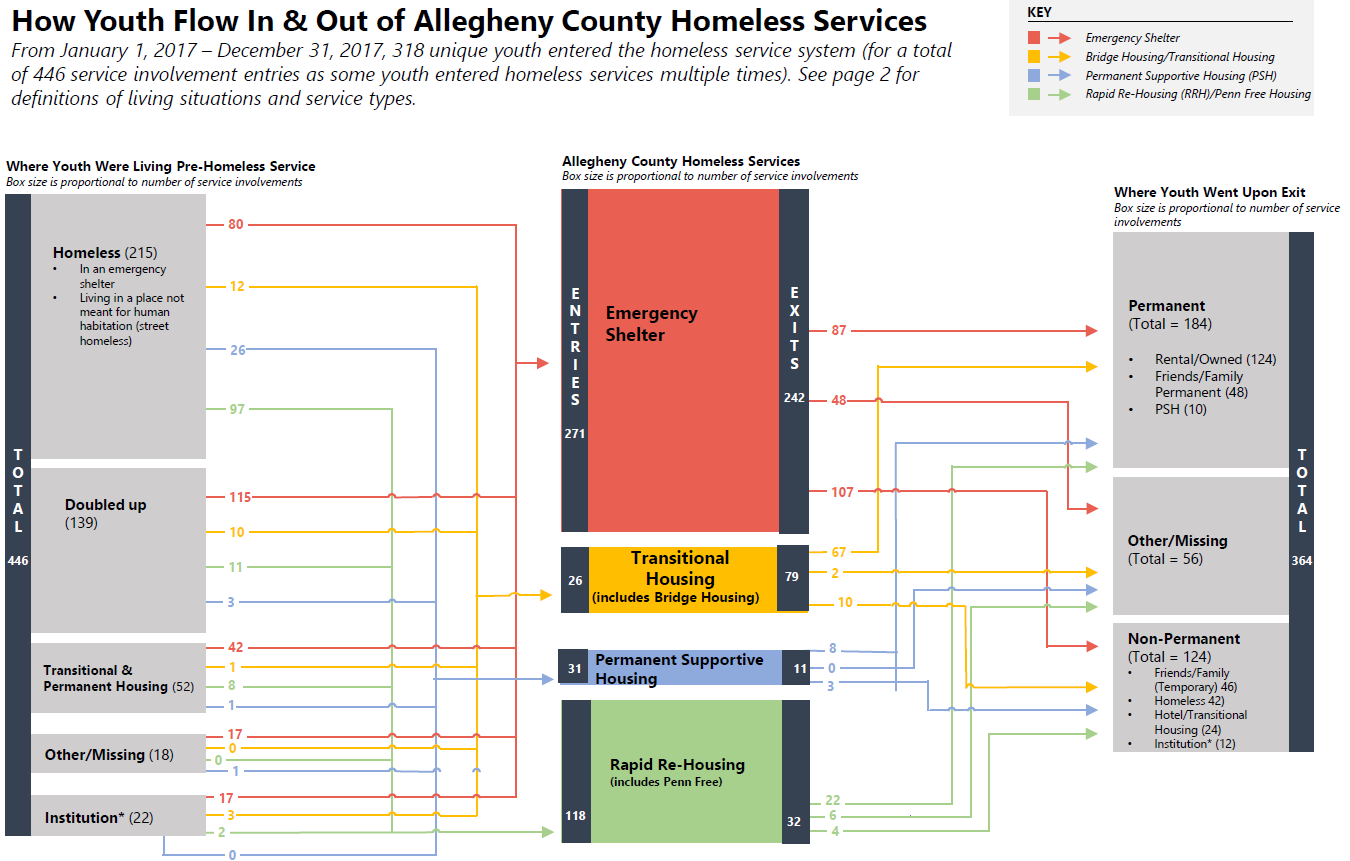
This infographic depicts the flow of homeless youth in and out of Allegheny County’s homeless service system in 2017. Analyzing the housing services that youth used — in addition to the places they were residing before and after receiving these services — helps inform outreach efforts and service planning. This is part of an effort to prevent and divert youth from homelessness and improve the housing outcomes of youth who do experience homelessness.
Using data from the County’s Homeless Management Information System (HMIS), 318 youth ages 18-24 who used a homeless service between January 1, 2017 and December 31, 2017 were identified. Residence before and after service utilization were self-reported by youth. Some youth entered the homeless system multiple times during this period for a total of 446 service involvement entries during the period of study. Not all youth who entered a homeless service in 2017 exited within the same year; as a result, total entries into service do not equal exits.
The left side of the chart shows where youth were residing prior to their use of homeless services. The most frequent location was in an emergency shelter or on the street (i.e., in a place not meant for habitation). The middle of the chart displays the homeless services used by youth; emergency shelters were accessed most frequently followed by transitional housing services. The right side of the chart displays where youth went after leaving a homeless service. Most youth went to permanent living situations, though many also went to non-permanent locations and data was not available for about a quarter of service exits.
Click here to view the infographic for 2017.
An infographic about services used by homeless youth in 2016 is available here.

