From January 2005 through July 2015:

  1. Aggravated assault rates generally declined in the City of Pittsburgh, but at a slower pace than in comparable cities.
  2. Aggravated assault was most prevalent in areas historically beset by violent crime, including the East End, the North Side and the South Side Hilltop neighborhoods.
  3. Victims of aggravated assault were disproportionately young, African American and male.
  4. Aggravated assault clearance rates were higher than those of comparable cities, but varied depending on the method of assault, location and victim demographics.

Click here to view the full report.

Click here to view an interactive visualization of crime in the city of Pittsburgh.


From January 2005 through July 2015:

  1. Pittsburgh’s theft rate declined and remained among the lowest in the Pittsburgh Today comparison group.
  2. Theft was most prevalent in Pittsburgh’s East End and South Side Hilltop neighborhoods.
  3. The clearance rate of theft varied depending on the category of theft or item taken.

Click here to view the full report.

Click here to view an interactive visualization of crime in the city of Pittsburgh.

From January 2005 through July 2015:

  1. Robbery rates declined, remaining among the lowest in the Pittsburgh Today comparison group.
  2. Robbery was most prevalent in neighborhoods historically beset by violent crime, including Homewood, Garfield and the North Side.
  3. Victims of robbery were disproportionately young and male, with high rates of victimization among African Americans.
  4. Robbery clearance rates were higher than those of comparable cities, but varied depending on the location of the crime and the demographics of the victim.

Click here to view the full report. 

Click here to view an interactive visualization of crime in the city of Pittsburgh.

From January 2005 through 2015:

  1. Rape rates fluctuated, but were generally lower by 2015 than they were in 2005.
  2. Rape was most prevalent in neighborhoods historically beset by violent crime, including the North Side, Homewood and the Hill District.
  3. Victims of rape were disproportionately young, African American and female.
  4. Rape clearance rates were higher than those of comparable cities, but varied depending on method of assault, time of year and victim demographics.

Click here to view the full report. 

Click here to view an interactive visualization of crime in the city of Pittsburgh.

From January 2005 through July 2015:

  1. Pittsburgh’s motor vehicle theft rate declined sharply and remained the lowest among comparable mid-sized cities.
  2. Motor vehicle theft was most prevalent in Pittsburgh’s East End, North Shore and South Side.
  3. Victims of motor vehicle theft were older than average crime victims and disproportionately African American and male.
  4. Motor vehicle theft clearance rates were higher than those of comparable cities, but varied depending on the location of the theft and whether the theft was completed.

Click here to view the full report. 

Click here to view an interactive visualization of crime in the city of Pittsburgh.

From January 2005 through July 2015:

  1. Drug violation rates decreased in the City of Pittsburgh, accompanied by reductions in adult and juvenile arrests.
  2. As drug violations declined, marijuana made up a larger share of all drug offenses as compared to drugs in the opioid/cocaine category.
  3. The highest drug violation rates were reported near Downtown Pittsburgh, the South Side Hilltop neighborhoods, the Southside Flats and the North Side.
  4. Nearly all reported drug violations culminated in an arrest, with nearly 20 times as many adults arrested as juveniles.

Click here to view the full report. 

Click here to view an interactive visualization of crime in the city of Pittsburgh.

From January 2005 through July 2015:

  1. Burglary rates in Pittsburgh were lower than in most comparable cities.
  2. Burglary was most prevalent in Pittsburgh’s East End, North Side and South Side Hilltop neighborhoods.
  3. Victims of burglary were disproportionately African American and tended to be older than victims of other Part 1 crimes.
  4. Burglary clearance rates were higher than those of comparable cities, but varied depending on the method of entry, location and time of year.

Click here to view the full report.

Click here to view an interactive visualization of crime in the city of Pittsburgh.

From January 2005 through July 2015:

  1. Arson rates increased in the City of Pittsburgh, contrary to trends observed in comparable cities.
  2. Arson was most prevalent in the Homewood, North Side and South Side Hilltop neighborhoods of Pittsburgh.
  3. Arson clearance rates were highest during the first months of the year and for arsons involving an occupied structure.

Click here to view the full report.

Click here to view an interactive visualization of crime in the city of Pittsburgh.

Unwieldy case backlogs and delays inspired a number of changes in how the Allegheny County Criminal Court processes cases.  By expediting plea offers, completing discovery and providing evidence at formal arraignments, and prioritizing clearing of old cases, the Court has realized a significant decrease in the number of active criminal cases. Other benefits of these changes include better adjudication of more serious cases, improved engagement by defense counsel and prosecutors, greater focus on problem-solving courts, and better management of jail overcrowding resulting from defendants awaiting trial for extended periods of time.

Click to read the full report. 

Intensive supervision programs like school-based probation are increasingly viewed as a way to generate savings to society, by preventing or reducing the likelihood of crime, as well as to improve outcomes for the juvenile offenders through an emphasis on education and employment opportunities. Allegheny County examined a number of outcomes for Pittsburgh Public School students under school-based probation before, during and after supervision, including participation in social services, educational outcomes, and future involvement in the juvenile and criminal justice systems. Of the students in school-based probation, more than 70 percent improved attendance during supervision and over 40 percent improved their Grade Point Average (GPA).  Interestingly, for students charged with misdemeanors, those who recidivate have more than double the absence rate during supervision than those who do not re-offend.

Click to read the full report.

Prepared by: Kathryn Collins, Ph.D., Erin Dalton and Emily Kulick

Linking provider payments to performance measures is gaining popularity as a way to improve outcomes, efficiency and innovations.  Three performance-based contracting models have been implemented in Allegheny County, targeting: 1) the Senior Center network; 2) child welfare providers; and 3) DHS-funded providers of the Allegheny County Jail Collaborative.  Each focuses on service-related outcomes and offers fiscal incentives for improvement.

Click here to view the full report.

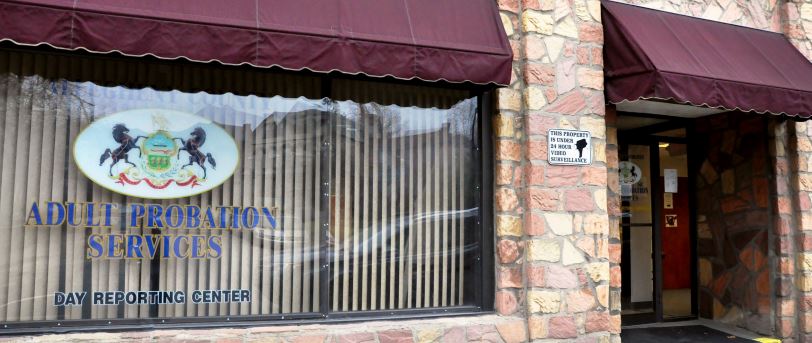
The Allegheny County Department of Human Services (DHS) worked with Adult Probation to conduct a cost–benefit analysis of Day Reporting Centers (DRC) for offenders who have re-entered the community. The analysis examined three groups of offenders (low-risk, medium-risk and high-risk) participating in employment search and community services at the DRCs from March 2011 through January 2013 and compared them to matched control groups of offenders supervised through a traditional field office.  When examining re-offending, medium-to-high-risk participants in the DRC had much lower rates of re-booking and convicted violations than the control groups, while low-risk offenders had relatively similar rates to the control group. This result supports the research literature that states that more intense supervision of low-risk offenders does not yield positive benefits.

Click to read the full report. 

From 2000 to 2012, Allegheny County Jail bookings decreased by approximately one-third. Arrests are the principal contributor to the number of bookings over time, but the number of arrests that result in a booking decreased over time due to changes in judicial procedure regarding arrests for Driving under the Influence (DUI) and use of a validated risk-assessment instrument to facilitate pre-trial release decisions.

The decrease in bookings was accompanied by an increase in jail-bed days used. Categorizing bookings into Length-of-Stay groups revealed that reductions in bookings from 2000 to 2011 were specific to stays of two days or less. The increase in jail-bed days used was impacted most significantly by an increased number of bookings for stays of one month or greater.  The report also examines inmates’ human service involvement and residence prior to booking.

Click to read the full report. 

Current information

The Allegheny County Pretrial Services Department works behind the scenes to provide information and make recommendations to judges who have to make rapid and critical decisions at Motions Court almost every day of the week. Created in 2007 by combining the bail agency and three other programs that work with defendants prior to trial, Pretrial Services has become a national model for how to handle pretrial decision-making in a more consistent and equitable way. This report describes how the Pretrial Service Department was created, how it functions, and the impact it has had on reducing unnecessary arraignment delays and jail stays.


This report was prepared in response to concerns about high levels of street violence, particularly in certain areas of the county, and to support the joint efforts of the Allegheny County Criminal Justice Advisory Board and the Allegheny County Executive’s Public Health Commission on Preventing Violence and Promoting Community Health.  It is the result of interviews with more than 50 practitioners; reviews of local, state and national programs; research on the roots of violence and evidence-based practices that have been effective in combating street violence; and discussions with noted experts in the field of criminal and juvenile justice. It presents recommendations of specific, proven strategies that can reduce street violence in Allegheny County within one to five years.

Click here to read the full report. 

An Executive Summary is also available.