All results for "police"
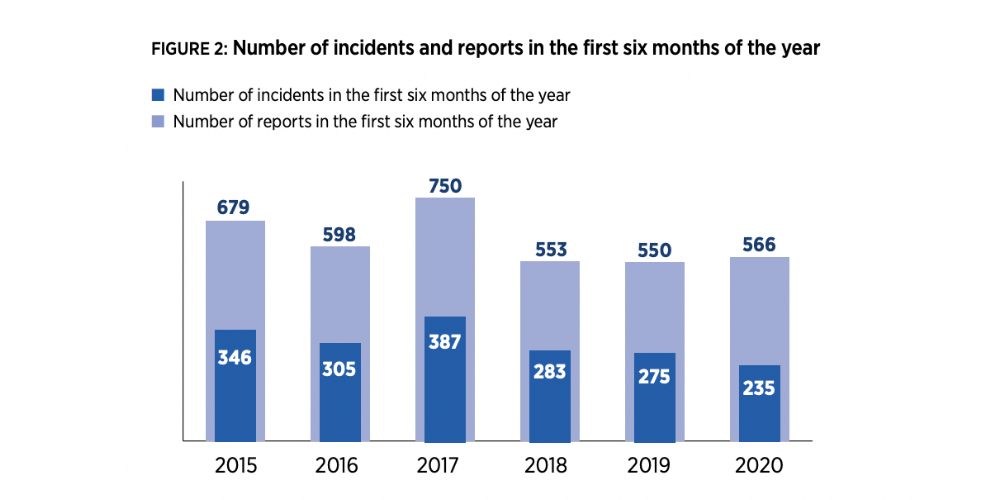
Use of Force by City of Pittsburgh Police
The City of Pittsburgh Bureau of Police tracks each incident in which an officer uses force with a subject. This report describes trends in use of force incidents and information about the circumstances and subjects involved.
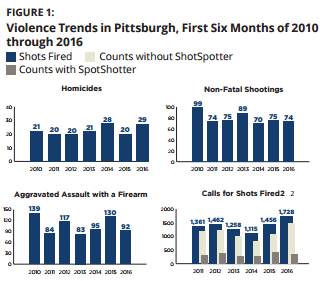
Violence in the City of Pittsburgh: Report Series
This series of reports presents data about homicides, shots fired, shootings and aggravated assaults with a firearm in the City of Pittsburgh. Demographic information about homicide victims and offenders, the […]

Aggravated Assault in the City of Pittsburgh
From January 2005 through July 2015: Aggravated assault rates generally declined in the City of Pittsburgh, but at a slower pace than in comparable cities. Aggravated assault was most prevalent […]
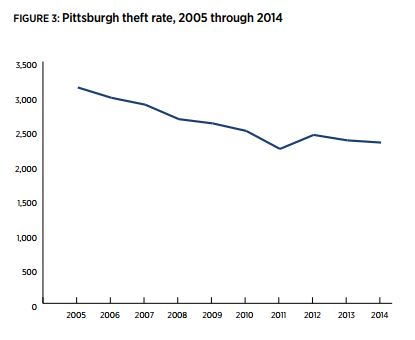
Theft in the City of Pittsburgh
From January 2005 through July 2015: Pittsburgh’s theft rate declined and remained among the lowest in the Pittsburgh Today comparison group. Theft was most prevalent in Pittsburgh’s East End and […]
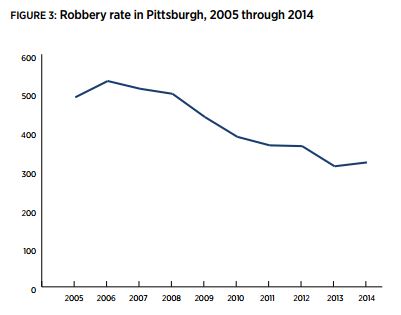
Robbery in the City of Pittsburgh
From January 2005 through July 2015: Robbery rates declined, remaining among the lowest in the Pittsburgh Today comparison group. Robbery was most prevalent in neighborhoods historically beset by violent crime, […]
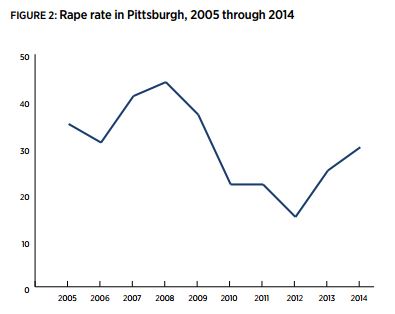
Rape in the City of Pittsburgh
From January 2005 through 2015: Rape rates fluctuated, but were generally lower by 2015 than they were in 2005. Rape was most prevalent in neighborhoods historically beset by violent crime, […]
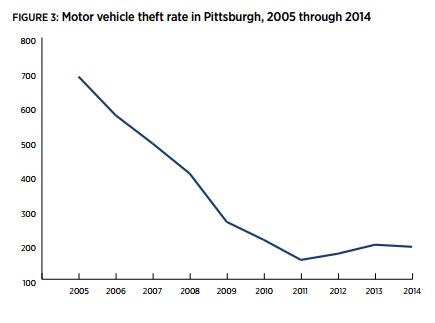
Motor Vehicle Theft in the City of Pittsburgh
From January 2005 through July 2015: Pittsburgh’s motor vehicle theft rate declined sharply and remained the lowest among comparable mid-sized cities. Motor vehicle theft was most prevalent in Pittsburgh’s East […]
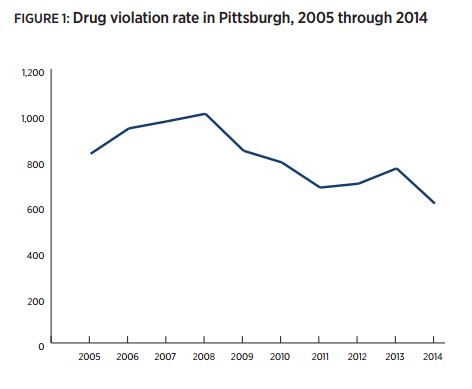
Drug Violations in the City of Pittsburgh
From January 2005 through July 2015: Drug violation rates decreased in the City of Pittsburgh, accompanied by reductions in adult and juvenile arrests. As drug violations declined, marijuana made up […]
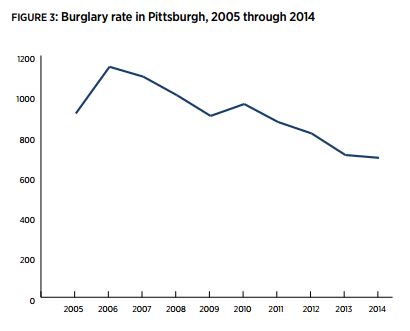
Burglary in the City of Pittsburgh
From January 2005 through July 2015: Burglary rates in Pittsburgh were lower than in most comparable cities. Burglary was most prevalent in Pittsburgh’s East End, North Side and South Side […]
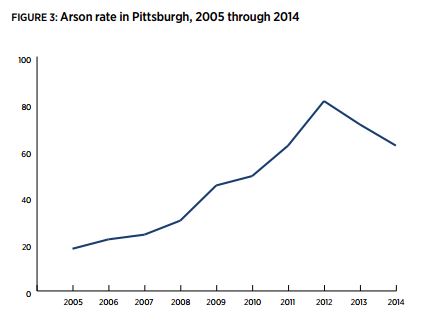
Arson in the City of Pittsburgh
From January 2005 through July 2015: Arson rates increased in the City of Pittsburgh, contrary to trends observed in comparable cities. Arson was most prevalent in the Homewood, North Side […]

Reducing Street Violence in Allegheny County: Research & Recommendations
This report was prepared in response to concerns about high levels of street violence, particularly in certain areas of the county, and to support the joint efforts of the Allegheny […]
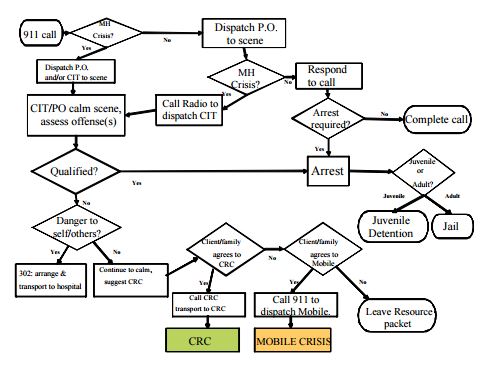
Evaluation of Allegheny County’s Crisis Intervention Team Training Program
This report summarizes the development, implementation and evaluation of a crisis intervention training program designed to teach police officers how to identify and intervene appropriately and safely with individuals with […]